.png?h=400&iar=0&w=1400)
National Health Service
The route to healthier cities starts with cleaner journeys, according to Douglas Gilmour, Global Traffic Lead at TomTom
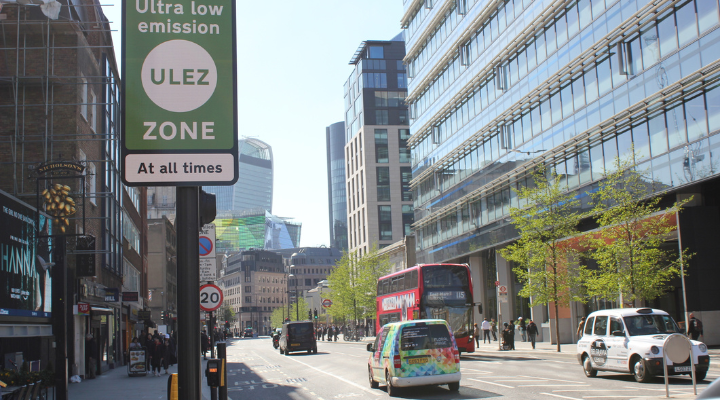
Recent research into London’s Ultra Low Emission Zone (ULEZ) has reinforced that the way cities manage movement can affect public health in tangible, long-term ways.
The study followed more than 3,400 primary-school children in London and Luton, Bedfordshire, 55km north of London, over a period of five years. It revealed that children in the capital whose lung growth had been affected by pollution saw their lung capacity catch up after ULEZ was introduced.
Cities are complex systems. Air quality, travel behaviour and public-health outcomes cannot be reduced to a single intervention. ULEZ was designed to reduce harmful emissions from the most polluting vehicles, not tackle congestion directly. Nonetheless, these findings reinforce a wider point for transport professionals. Decisions on streets, traffic and access are also decisions about health.
For cities across Europe, the next challenge is to build on low-emission-zone policies with a more connected approach to mobility. That means using evidence to understand where vehicles are travelling, where traffic slows or stops, how people move through neighbourhoods, and where poor air quality and road danger are felt most acutely.
Source: Lorna Roberts
The aim should be journeys that are cleaner, greener and smoother, while making urban areas safer and more liveable for the people who spend time in them.
For cities across Europe, the next challenge is to build on low-emission-zone policies with a more connected approach to mobility
A low-emission zone is not the whole answer
Low-emission zones are an important lever for improving air quality. By encouraging cleaner vehicles and restricting the most polluting ones, they reduce exposure to pollutants like nitrogen dioxide. But a zone cannot answer every mobility question a city faces.
Authorities need to understand what happens around zone boundaries, near major junctions and in the neighbourhoods surrounding schools, parks, high streets and homes. A restriction that improves conditions in one location should not create new pressure elsewhere. Likewise, cleaner air should be supported by streets that feel safe and practical for walking, cycling and using public transport.
This is where location intelligence plays a key role. Anonymised, aggregated vehicle-trip making data can show how city movement changes over time. This includes the routes people take, points where traffic repeatedly slows, and how journey times vary through the day. Combined with collision records, public-transport performance and pedestrian counts, it gives planners a clearer understanding of how a city works in practice.
Anonymised, aggregated vehicle-trip making data can show how city movement changes over time.
Why does this matter? Because traffic conditions are rarely static. Whether it’s roadworks, school terms, weather, public-transport disruption or changes to street layouts, they all alter the way people travel. Regularly reviewing those patterns gives authorities a stronger basis for deciding where intervention will have the greatest value.
The most effective policies consider the experience of everyone who lives, works, learns and travels alongside it.
Designing streets around people and traffic
Children provide a particularly important lens. As the recent ULEZ study illustrates, they are more vulnerable to air pollution because their lungs are still developing. What’s more, they are often exposed close to the source of emissions on journeys to school, while walking along busy roads or waiting at crossings.
A healthier city should make it easier for children and families to choose active travel where appropriate. This is not as simple as adding isolated cycle lanes or changing one junction. It requires connected, safe routes that people are confident using, along with crossings that work for pedestrians, public transport that is reliable, and street layouts that reduce unnecessary conflict between different road users.
Data helps turn these broad goals into targeted action. For example, a city might identify a corridor where buses face recurring delays, vehicles spend long periods in stop-start conditions and there is heavy footfall close to traffic. That evidence could support bus priority, safer crossings or improved walking and cycling connections.
No single measure will suit every place. In some areas, the best outcome may come from reducing through-traffic. In others, it may be improving the appeal and reliability of public transport so fewer journeys are made by car.
The key is to assess the whole journey rather than treating congestion, safety and accessibility as separate challenges. Done well, this can make short trips easier to take on foot, by bike or by public transport, and reduces avoidable vehicle movements.
A city might identify a corridor where buses face recurring delays, vehicles spend long periods in stop-start conditions and there is heavy footfall close to traffic. That evidence could support bus priority, safer crossings or improved walking and cycling connections.
Safer streets do not have to mean slower cities
The ongoing debate around 20mph limits in London illustrates why that joined-up perspective is needed. Lower speeds are principally a road-safety intervention. Particularly in places where people and vehicles share space. They can also help create environments where walking and cycling feel more viable. But the impact on traffic flow, journey times and surrounding routes must be understood in local context.
The DfT’s 2018 evaluation of signed-only 20mph limits, led by Atkins with AECOM and University College London, drew on GPS-based journey-speed data across 12 English case-study areas. Its methodology recognised the value of measuring full journey speeds, including stationary time, rather than relying solely on spot-speed surveys.
That distinction is useful. Cities need to know whether a measure changes how people travel across the network, rather than simply what occurs at a single point on a road. Network-wide patterns can help planners identify traffic displacement, effects on bus reliability and where complementary measures may be needed.
This does not mean smoother journeys should always mean faster vehicle journeys. In a healthy city, safety takes priority in the places where people walk, cycle and cross roads. But if authorities can see how a network responds, they can better balance safety, public-transport reliability and emissions outcomes.
Cities need to know whether a measure changes how people travel across the network, rather than simply what occurs at a single point on a road
Learning from real-world change
Source: Nico Elmino
Dublin offers a useful example of how transport authorities can use mobility data as part of this wider assessment. In Dún Laoghaire-Rathdown, the National Transport Authority and local stakeholders used anonymous, aggregated vehicle speed data alongside other sources to examine changing traffic volumes, speeds, trip patterns and journey times during a period of significant change to public space and travel behaviour.
The work examined how vehicles moved through the area while also considering walking, cycling and public-transport conditions. This helps distinguish between local traffic, through-traffic and longer-distance trips, supporting better decisions about road-space allocation and how changes affect the surrounding network.
It also demonstrates that traffic information is most useful when it is combined with on-the-ground evidence and local expertise. The question that needs answering is whether the street is becoming a better place for the people who use it.
That principle applies across Europe as more cities introduce low-emission zones and rethink their transport networks. In Belgium, a recent quasi-experimental study of low-emission zones in Antwerp and Brussels found that key traffic-related pollutants fell faster than in control cities, with improvements extending beyond the zones themselves. That matters because it underlines the value of monitoring the wider network, not simply conditions within a charging boundary. The policy details will differ by city, but the need for evidence-led decision-making remains the same.
In Belgium, a recent quasi-experimental study of low-emission zones in Antwerp and Brussels found that key traffic-related pollutants fell faster than in control cities
A practical route forward
The London lung-health findings should encourage cities to be ambitious while remaining rigorous about how they design and evaluate interventions. Cleaner vehicles matter. But so do safer streets, reliable public transport and alternatives to short car journeys.
For transport authorities, that means building a clear baseline before changes are made and refining plans where evidence shows unintended consequences. It means considering exposure and safety around the places people spend their everyday life, especially schools and neighbourhood centres. It also means looking across departmental boundaries, because transport, environmental health and public health are closely connected.
The opportunity is significant. By combining low-emission policies with a detailed understanding of real travel patterns, cities can reduce harmful emissions while improving the quality of everyday journeys. The result should not be a city optimised for moving vehicles. It should be one designed to help people move safely, breathe more easily and get where they need to go with greater confidence.
Share your story
Do you have an innovation, research results or an other interesting topic you would like to share with the professionals in the infrastructure, traffic management, safety, smart mobility and parking industry? The Intertraffic website and social media channels are a great platform to showcase your stories!
Please contact our Sr Brand Marketing Manager Carola Jansen-Young.
Are you an Intertraffic exhibitor?
Make sure you add your latest press releases to your Company Profile in the Exhibitor Portal for free exposure.
.png?h=400&iar=0&w=1400)
.png?h=628&iar=0&w=1200)
.png?h=400&iar=0&w=1400)
Get up to speed on the mobility industry - our newsletter straight to your inbox!