Speeding up the mobility transition - Sander van der drift
Big data Speeding up Traffic management

Speeding up the mobility transition: Sander van der Drift, DAT.Mobility

Wednesday, 17 June 2020

‘Data provides valuable insights, but we need creativity to make the change’

With the continuous growth of the population and ongoing urbanization there are numerous mobility challenges. Sustainability, safety and societal impact are amongst our daily concerns. We need to speed up the mobility transition to keep up with the fast changing global dynamics, which requires inventive approaches and better solutions. In this series we share inspiring and innovative cases from all over the world. Sander van der Drift of DAT.Mobility (a Goudappel company) has become well known in the Netherlands since Corona. Data analytics provided by him and his team gives us insight in the movement of people. How did he speed up the mobility transition.

Sander van der Drift is a geo-data scientist for DAT.Mobility, a Dutch company for IT solutions and data analyses for mobility. Since the outbreak of the Coronavirus he has become well known in the Netherlands for giving insights into the changed movement patterns in The Netherlands. He derives his insights from an innovative new data source: the Dutch Mobility Panel (Nederlands Verplaatsingspanel). Sander explains how this works.


‘Traditional measurement methods showed us a decrease in traffic, but it did not show what actually happened to this traffic’

‘Up until the outbreak of the Coronavirus we saw an immense pressure on the transportation system in large parts of the country. Congestion was increasing, cyclist numbers were growing substantially, and public transport often exceeded the forecasted volumes. Oddly enough, even before the virus outbreak, we had difficulty substantiating and quantifying policy impacts and identifying trendsetters. Traditionally, we monitored traffic movements using traffic counts, floating car data, chip cards or smart camera systems. These measurement methods could show a decrease in traffic, but did not show what actually happened instead. Traffic counts are available, but they mainly involve car traffic and certainly do not cover the entire country. There is no complete picture. Are we actually witnessing a mobility transition? Policies are in any case being proactively put in place to accelerate change.’

The corona crisis has taken us into unchartered territory, requiring us to look at mobility in a different way. What will be the new roles of cars, cycling, and public transport? Will shared mobility accelerate? Will we travel at different times? Will we be working from home more often? Are there any differences ages and educational levels? These are all questions that currently need answering by central and local governments.

‘Fortunately, we are now able to provide answers based on the Dutch Mobility Panel, a joint initiative of DAT.Mobility, Kantar and Mobidot. This panel consists of approximately 5,500 volunteers, who travel around with a digital travel diary that automatically captures all their movement patterns, 24/7. The analysis of these patterns provide valuable insights for policymakers into the Dutch traffic situation and is useful to study the effect of new measures that are put in place.’

'After the outbreak, car traffic decreased by more than 50% and people abandoned public transport'

'In the weeks after the press conference in March from Dutch prime minister Mark Rutte, announcing the intelligent lock-down in the Netherlands, car traffic decreased by more than 50%. The morning and evening rush hour just disappeared. Thanks to our panel, it became clear to us that people stayed at home and made the switch from public transport and car towards walking and cycling. Trips changed from commuting to recreational purposes. On an average working day before the Corona outbreak, 1.3 million people travelled by train. At the end of March only 10% remained, counting 130,000 train travellers.’

Average travel time per person per mode of transportation

Speeding up the mobility transition Sander van der Drift DAT.Mobility


‘Thanks to our panel and real-time data collection, we can quantify what we observe’

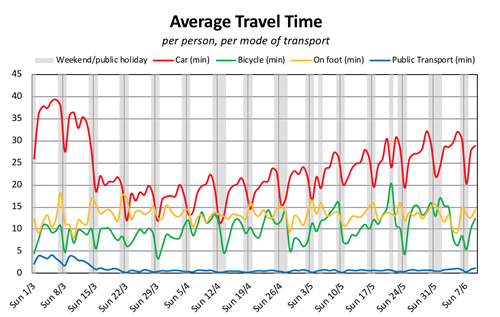
‘Thanks to our panel and collection of real-time data, we can quantify what we observe in traffic and transport almost instantly. Other interesting patterns appeared: more and more people opted for a short walk around the block after lunch and dinner time. On some days people spent more time walking than driving in their car. Something that normally only occurs on Kings day (public holiday). After a sharp decline in shopping in general, we noticed an increase to hardware stores and garden centres.’

‘In the last weeks, we have seen a steady grow of car traffic and I expect this will increase to normal levels in the weeks to come. City centres are attracting more visitors. The use of public transport remains low, but I wonder what will happen when we open up little by little.’

‘At DAT.Mobility, I spend most of my time on innovation and analyses in the field of mobility. The studies range from public transport to cycling and from driving to walking. It is our ambition to give policymakers the best information available so they can make their policies even more effective. My aim and passion is to provide well-grounded insights in mobility which are innovative and complex, yet visually attractive and easy to comprehend by policy makers.’

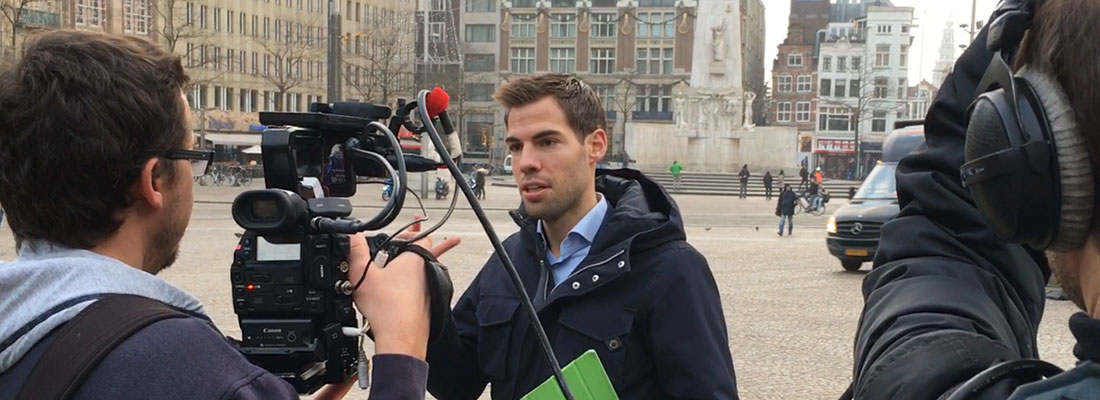
‘My job and tasks definitely changed since the intelligent lockdown. There were days where I had the role of data analyst, spokesman and PR-consultant in one. Interesting times. Our insights were published in most of the major national newspapers in The Netherlands. Very exciting. However, my absolute highlight was to the very first item of the national tv-news at prime time on a Saturday, providing them with the latest insights about our movement patterns in Corona times.’

‘I don’t believe in the use of data only’

‘You ask me about my view on the mobility transition? Well, as data-analyst I find it important to know and follow the facts. I truly believe data can help us in optimising our mobility system. However, I don’t believe in the use of data only. Critical thinking and a thorough interpretation by humans is crucial. Data won’t solve everything. It provides valuable insights, but we need creativity and new concepts to make the change. Nevertheless, it goes without saying that data will play a big part in our future.’

‘Take this outbreak. Both our data and us have benefited from it. It brings us new challenges and it has speeded up our innovation. We plan to expand and continue the panel so we are able to do more in-depth and advanced analyses in the future. The more history we built up, the more interesting questions we are able to answer. We could for example study the impact of live events on the way people travel. Does someone switch to other modes of transport when he/she becomes a parent? It is my passion to discover and analyse new things with the help of data available and to translate these stats into understandable reports and visuals that policymakers can make use of. I look forward to doing more of this in the future.’

Sander van der Drift is geo-data scientist at, a Dutch company for IT solutions and data analyses for mobility. DAT.Mobility has 40 employees and works closely with the more than 200 mobility experts of Goudappel Coffeng. Their aim is to make mobility choices more visible, simpler, and more effective, for today’s journey and tomorrow’s world.

Share your story

Do you have an innovation, research results or an other interesting topic you would like to share with the professionals in the infrastructure, traffic management, safety, smart mobility and parking industry? The Intertraffic website and social media channels are a great platform to showcase your stories!

Please contact our Sr Brand Marketing Manager Carola Jansen-Young.

Are you an Intertraffic exhibitor?

Make sure you add your latest press releases to your Company Profile in the Exhibitor Portal for free exposure.